 Banana
Engineering
15 ms to 2.3 ms: an AI-driven hill climb on our calendar renderer
We’re building Banana, a native planning app that brings Google calendars from multiple accounts into one unified day across iPhone, iPad, and Mac.
36,500 events across 12 calendars, on an iPhone 14 Pro. Scrolling the Week view cost 15 ms of app work per update; it now costs 2.3 ms. Preparing a day’s event blocks went from 29 ms to 16 ms.
We want to build the smoothest interface we can. Our goal is 120 fps throughout the application, at all times on displays that support it. We know we are not there yet. This calendar work is part of how we get there.
Each event view contains its title, time, icons, and background. Our old Day and Week views hosted the full day’s SwiftUI event-view tree inside a UIScrollView. We replaced that host with a UICollectionView that creates and reuses event cells as they are needed. The event geometry and block-drawing code stayed the same.
This came out of an AI-driven performance hill climb. We set the calendar workload and performance requirements, then used a coding agent to implement alternatives, run comparisons, investigate failures, and iterate. The agent worked on the renderer and the tests used to judge it.
Before and after
| Old Day view | New Day view | |
|---|---|---|
| Scroll host | UIScrollView |
UICollectionView |
| Event views | Full day’s SwiftUI event-view tree | Reusable cells requested by the viewport |
| Event placement | Existing calendar geometry | Same geometry |
| Block drawing | Prepared event blocks | Same prepared-block path |
| Blocks prepared to show one day | 104 to 108 | 48 |
| Preparation work, iPhone 14 Pro | 29.1 ms mean | 16.4 ms mean |
The preparation numbers are the app’s own measurement of the main-thread work to draw and cache event blocks when a day appears, read back from the phone. A 30-day fixture with 100 new events per day, launched eight times in old/new/new/old order rather than once each:
| Launch | Day view | Blocks drawn | Total preparation work |
|---|---|---|---|
| 1 | Old | 108 | 37.751 ms |
| 2 | New | 48 | 16.348 ms |
| 3 | New | 48 | 16.721 ms |
| 4 | Old | 104 | 27.031 ms |
| 5 | Old | 104 | 27.126 ms |
| 6 | New | 48 | 16.029 ms |
| 7 | New | 48 | 16.562 ms |
| 8 | Old | 105 | 24.499 ms |
Launch 1 is the process-cold one and carries an 8.4 ms first block; the other old launches sit at 24.5 to 27.1 ms, the new ones at 16.0 to 16.7 ms every time. Memory held by the displayed block images fell from 14.4 MB to 10.0 MB.
Individual blocks did not become faster to draw. We reduced the number that needed drawing. The total adds up several preparation jobs; it is not a single frame or the time until the calendar appears. The experiment that pointed here ran in the iPhone Simulator on October 10 with the same fixture and showed the same shape, 107 blocks and 95 ms against 45 blocks and 38 ms; the Simulator’s absolute numbers are not the phone’s, which is why the phone’s are the ones above.
View virtualization and cell recycling
This is view virtualization: keep the event data and geometry, but create views only when the viewport needs them. Cell recycling lets the scroll container reuse views as events enter and leave the screen.
We split the calendar into event placement, view lifetime, and drawing. The placement rules still handle overlap lanes and event frames. The collection view manages the cells. A cell asks for its SwiftUI content when needed.
A shortened version of the descriptor passed to the viewport is:
struct CalendarViewportItem {
    let id: String
    let frame: CGRect
    let content: () -> AnyView
}
The closure lets us describe an event without constructing its view immediately. On iOS, UIHostingConfiguration hosts the SwiftUI content inside the reusable UIKit cell. Mac has a separate AppKit NSCollectionView host.
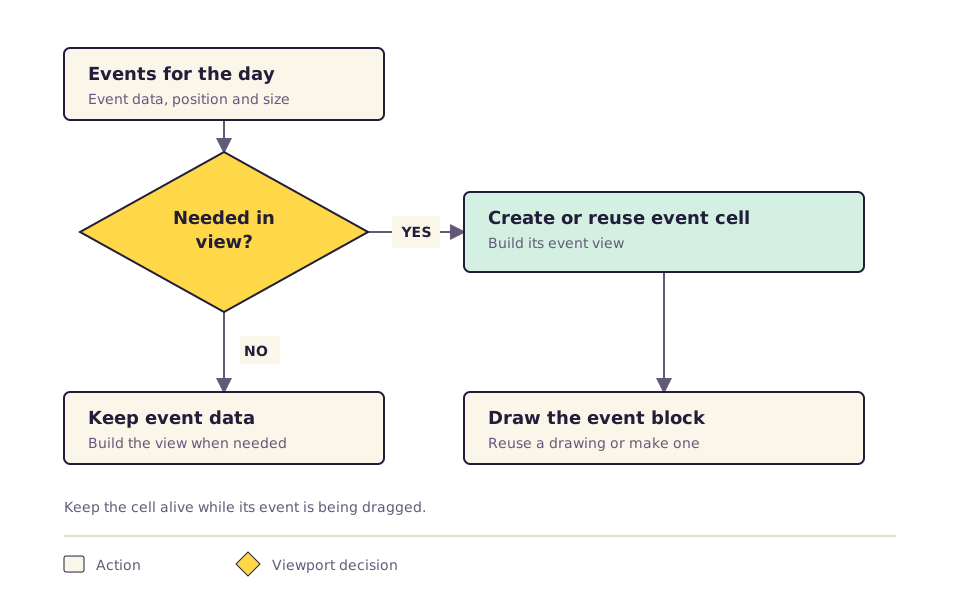
That separation gave the agent smaller changes to test. It could change the scroll host while retaining the placement rules and drawing code, then evaluate drawing changes separately.
It also made the remaining costs easier to name. Our fixed-frame layout still scans cached attributes to find intersecting events. Reusable cells reduce the live view tree; they do not remove placement work or make retained calendar history disappear.
Libraries and tools we evaluated
We looked at existing calendar components before building our own host:
| Library | What we evaluated | What it meant for this calendar |
|---|---|---|
| CalendarKit | Its day timeline, event pool, and overlap layout; pinned in our isolated benchmark | A useful iOS comparator. At the inspected revision, its event-view lifecycle would still need changes, and it did not provide an AppKit host. |
| KVKCalendar | Its multi-day timeline and custom event-view/layout hooks; also pinned in the benchmark | The closest mobile week-view candidate. Those hooks did not supply the vertical event virtualization we wanted. |
| HorizonCalendar | Incremental visible-item lookup and view reuse | A useful architecture reference for virtualization. Its date/month grid was not a drop-in hourly event timeline. |
We also source-screened JZCalendarWeekView, which uses reusable collection-view cells, and the native macOS ScheduleKit. Compatibility, maintenance, and the amount of rendering code we would still own were part of the decision. We reviewed the source, but did not fully benchmark each of these.
The path used for the headline result relies on UIKit/AppKit collection views and SwiftUI cell content. We separately investigated Core Graphics, Core Text, and Skia with Metal for drawing. The Skia experiments still had visual-parity and cache-correctness failures, so they did not become a new shipping renderer.
For measurement, XCTest exercised scrolling, paging, selection, and reuse; Instruments supplied Time Profiler and Animation Hitches traces. We used xctrace and simctl in the collection scripts, plus image comparisons to check rendering changes. Gesture duration, drawing time, and frame delivery stayed separate measurements.
What the agent had to preserve
Reusing cells introduces lifecycle problems. A drawing job can finish after its cell has been assigned to another event. A cached block can become stale after a title edit, resize, appearance change, or text-size change. That is the cache invalidation problem: reuse the drawing only while all of its inputs still match. Cache eviction must leave the current event visible until a replacement is ready.
We kept immutable drawing inputs separate from gestures, accessibility, and pending edits. The cell owns those interactions. The cached drawing does not.
An overnight event adds another complication: one occurrence can have visible pieces in two day columns. We give each displayed piece a day-specific identity while keeping its actions attached to the original occurrence. Otherwise reuse can confuse the two pieces with independent events.
The AI hill climb had to preserve those behaviors while changing performance. We kept reference paths and explicit comparison switches, fixed the workload, and retained failed runs. Raising the performance threshold was not a candidate improvement.
Hardware behind the numbers
Our build and Simulator machine is a MacBook Pro with an M1 Max, 10 CPU cores, 32 GPU cores, and 64 GB unified memory. It is a shared development machine. Other builds can consume the same CPU, memory, and GPU resources, so run order and host activity matter.
The preparation comparison above ran on the spare iPhone 14 Pro. The October 10 experiment that pointed to it ran in the iPhone 17 Pro Simulator on iOS 26.5, on that Mac. We also tested the calendar on:
| Physical device | Calendar tests |
|---|---|
| Spare iPhone 14 Pro, A16, iOS 27.0.1 | Scrolling, paging, cache recovery, renderer experiments, Instruments captures, and the matched old/new scroll traces below |
| iPad Pro 12.9-inch, fifth generation, M1, iPadOS 27.0.1 | Scrolling, paging, cache recovery, renderer experiments, Instruments captures, and the matched old/new scroll traces in both orientations |
The phone and tablet results are separate from the Simulator comparison. We do not use a fast run on the M1 Max as evidence that the same work is fast on an iPhone.
On the phone: Week got fast, Day did not
Preparation is load-time work. The question a reader should ask is what happens while you scroll. On October 29 we ran the matched comparison on the same phone: the spare iPhone 14 Pro, the same isolated fixture app, 36,500 events across 12 calendars and 365 days, the same 16 swipe-up/swipe-down window, Instruments attached for eight seconds, old/new/new/old order. We read the update intervals Animation Hitches attributes to the app. "Old host" is the UIScrollView with the full-day SwiftUI tree; "new host" is the UICollectionView with reusable cells. Each host was traced twice, so a cell such as "14.9, 15.1 ms" holds both runs, the first and then the second.
| View | Host | Updates in window | p50 | p95 | Max | Over 8.3 ms |
|---|---|---|---|---|---|---|
| Week | Old host | 230, 218 | 14.9, 15.1 ms | 46.1, 47.6 ms | 90.9, 100.9 ms | all |
| Week | New host | 605, 599 | 2.3, 2.4 ms | 7.2, 7.3 ms | 12.7, 12.0 ms | 17, 20 |
| Day | Old host | 630, 637 | 1.9, 2.0 ms | 3.1, 3.1 ms | 157, 159 ms | 8, 8 |
| Day | New host | 665, 634 | 2.0, 2.2 ms | 7.7, 7.4 ms | 149, 144 ms | 29, 22 |
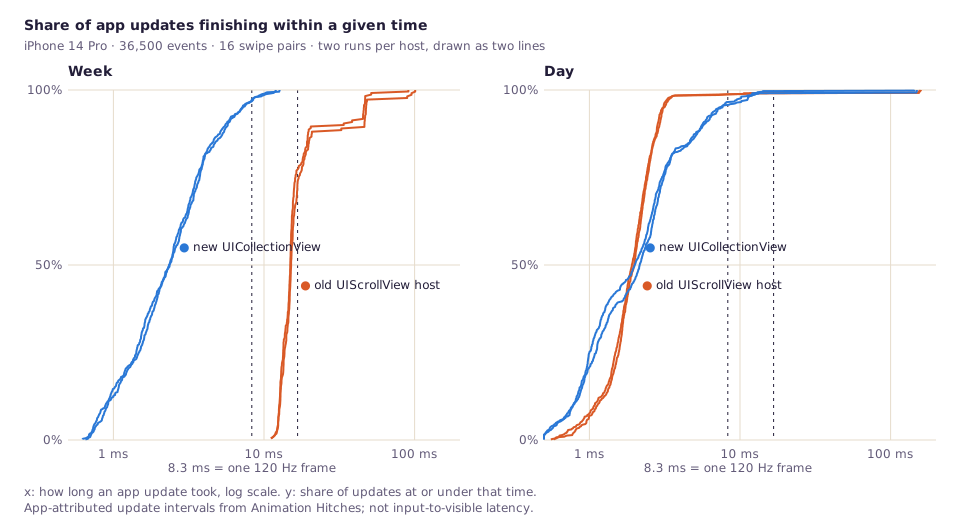
Week is where the change pays. The old host's median update was 15 ms, no update fit in a 120 Hz frame, and the display fell to 60 Hz and lower cadences. The new host's median is 2.3 ms, p95 7.2 ms, worst 12.7 ms, and the display mostly kept its 8.3 ms cadence.
Day is not an improvement in this sample, and we are saying so. The old host built the entire day's view tree up front, so scrolling it was nearly free. The new host does per-cell work while you scroll: still inside 8.3 ms at p95, but with about three times as many over-budget updates. The preparation saving above is load-time work; this is scroll-time work, and on Day they trade against each other.
Both Day hosts also showed the same 150 ms update about every 2.7 seconds. It did not move with the viewport change, so the viewport neither caused nor fixed it. We profiled it the same evening; that story is below.
While the phone was on the bench we also tested a hypothesis that had sat in a code comment since the viewport landed: UIKit cell prefetching, which prepares cells ahead of display, was disabled and "never measured". Measured, in the same clear/prefetch/prefetch/clear pattern, it raised the median update on both views (Day 2.2 to 2.7 ms, Week 2.3 to 2.9 ms) and lowered nothing. It stays off. Negative results are part of a hill climb; the harness exists so they cost twenty minutes instead of a release.
These are app update intervals from one device and eight-second windows. They are not input-to-visible latency.
On the iPad: the same direction, a smaller margin, and orientation matters
The next day we ran the same matrix on the iPad Pro 12.9-inch (M1) over USB, in landscape and again in portrait, same fixture app, workload, window and order. The iPad shows far more of the calendar at once: 93 to 111 Week cells and 40 to 59 Day cells, against the phone's few dozen. As on the phone, each cell shows the two accepted runs, first and second.
| View | Orientation | Host | p50 | p95 | Worst update | Over 8.3 ms |
|---|---|---|---|---|---|---|
| Week | Landscape | Old host | 11.8, 11.5 ms | 14.4, 13.6 ms | 43, 42 ms | all |
| Week | Landscape | New host | 2.3, 2.3 ms | 12.7, 12.4 ms | 20, 21 ms | 79, 92 |
| Week | Portrait | Old host | 11.3, 10.9 ms | 13.5, 13.3 ms | 46, 45 ms | all |
| Week | Portrait | New host | 2.5, 2.5 ms | 8.6, 10.5 ms | 116, 125 ms | 28, 51 |
| Day | Landscape | Old host | 0.8, 1.3 ms | 1.6, 1.9 ms | 41, 42 ms | 6, 6 |
| Day | Landscape | New host | 1.6, 1.7 ms | 7.2, 9.5 ms | 49, 68 ms | 23, 36 |
| Day | Portrait | Old host | 0.5, 0.6 ms | 1.3, 1.2 ms | 40, 40 ms | 12, 12 |
| Day | Portrait | New host | 2.2, 2.2 ms | 9.4, 9.8 ms | 90, 95 ms | 32, 43 |
Week moves the same way as on the phone, less far. The old host's median is 11 to 12 ms in both orientations and no update fits a frame; the new host's median is 2.3 to 2.5 ms. But the new host's p95 is over budget on the iPad, 12.5 ms in landscape and 8.6 to 10.5 ms in portrait, where the phone's was 7.2 ms, and portrait adds a 116 to 125 ms worst update that landscape does not have. Per-cell work scales with cells on screen, and the iPad has two to three times as many.
Day is the phone's result, wider. The old host's prebuilt tree scrolls in under a millisecond at the median; the new host pays 1.6 to 2.2 ms, with p95 at or over 8.3 ms and worst updates of 49 to 95 ms. Both hosts share a roughly 40 ms update in every iPad run that is not the stall we fixed and is not yet attributed.
Two notes on method. Orientation is an input to the test, recorded with each trace, because the tails differ by two to six times between the two; an iPad number without its orientation is not a number. And six of the ten portrait traces of the new host were refused by our analyzer because one or two of its roughly 450 updates had no matching row in Instruments' GPU table. The rule is all-or-nothing and we did not loosen it; we ran more matrices until each cell had two accepted runs, and the refused traces are kept in the evidence folder as failures.
The preparation comparison on the iPad, two rounds of old/new/new/old launches in landscape: the old host prepared 103 to 106 blocks in 42.8 ms on average, the new host 51 to 54 blocks in 28.5 ms. That is 34% less preparation against the phone's 44%, because the larger viewport leaves fewer blocks off-screen to skip. An earlier partial run that happened to be in portrait, where more of the day is visible, pointed at a saving nearer 20%; the collector does not yet record orientation, so we quote the landscape number and the caveat together.
The 150 ms stall: found with the same harness, fixed the same evening
The periodic Day update deserved its own trace. We recorded eight seconds of Day scrolling with Time Profiler attached, then looked for contiguous main-thread windows of 100 ms or more. There were three, at +2.25, +5.00 and +7.95 s, and inside them 95% of main-thread time was one stack: the plan card above the calendar asked the occurrence store for "the next alert Banana would send", and the store answered by scanning every one of the 36,500 events, checking each against the muted-calendar settings, inside a SwiftUI body evaluation. Outside those windows the same stack was under 2%. Neither host was at fault; the card sits above both.
The fix is unglamorous: cache the candidates, keyed on a revision counter the store bumps whenever its timeline is assigned and on the mute set, so a body evaluation costs a lookup. Four unit tests pin the behaviour. Re-measured on the same phone with the fix installed, again two runs per cell:
| View | Host | p50 | p95 | p99 | Worst update |
|---|---|---|---|---|---|
| Day | Old host | 2.0, 1.9 ms | 3.1, 3.0 ms | 8.1, 39.7 ms | 59, 45 ms (was 157, 159) |
| Day | New host | 2.4, 2.2 ms | 7.0, 7.0 ms | 11.2, 13.2 ms | 37, 36 ms (was 149, 144) |
| Week | New host | 2.2, 2.4 ms | 7.4, 7.4 ms | 11.3, 10.4 ms | 22, 14 ms |
Medians and p95 did not move, which is the point: this was a stall, not per-update work. The worst Day update dropped by about 110 ms on both hosts. A 36 to 59 ms tail remains, and it is the next thing to attribute.
This is what the hill climb looks like day to day. The viewport change was the big move; the harness built to judge it then found a bug that predates it, and the fix took an afternoon because the measurement said exactly where to look.
We are still working toward the frame budget
At 120 fps, there is about 8.3 ms between frames. We also want direct input feedback under 10 ms at p95, with a 20 ms maximum. Saving drawing work gives us more room in that budget. We still need to show that the savings lead to consistently smooth scrolling and interaction on real devices.
The physical traces still show slow tails: a 36 to 59 ms Day update on the iPhone 14 Pro after the stall fix, and on the iPad Pro new-host worst updates of 49 to 68 ms (Day, landscape), 90 to 95 ms (Day, portrait) and 116 to 125 ms (Week, portrait). These intervals include more than drawing.
We need to keep measuring cold preparation, warm reuse, eviction, and real scrolling.
The result we can point to today is specific: on an iPhone 14 Pro with 36,500 events, replacing the full-day view tree with reusable cells took Week scrolling from 15 ms to 2.3 ms of app work per update and cut a day’s block preparation by 44%. The next job is to make the calendar consistently meet its interaction and frame budgets on the physical devices.
Source and reproduction
The calendar renderer and benchmark harness are in AbregaInc/banana on GitHub.